Oceanography – Current Models
We are using oceanographic modeling to simulate how the water moves along the coast and transports larvae in central California. Many fish species (including our study species kelp rockfish) release larvae into the water column that are moved around by the ocean currents as they develop before settling in suitable habitat. This pelagic larval stage is very challenging to study because the larvae are very small (~1-2 mm). These larvae are too small to track using GPS tags or by releasing drifters in the vicinity because the water moves a larger drifter buoy differently than a small larva.
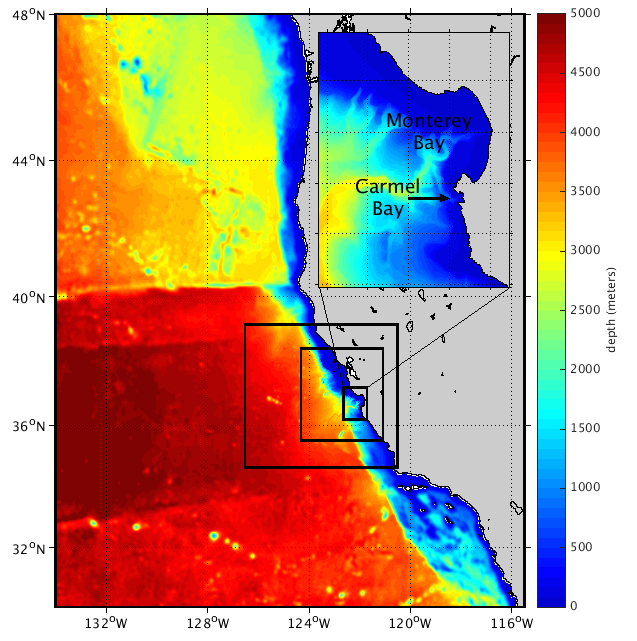
Figure 1. Shows the nested model domain. The outermost nest spans the entire US west coast at ~3 km resolution, followed by three nests with increasing resolution at ~1 km, ~350 m, and ~120 m resolution, respectively. The inset in the upper right corner shows the highest resolution nest and labels the study region. The color represents bathymetry (or bottom depth).
We have built an ocean model that encompasses the US west coast and then zooms into higher resolution on the central California region (figure 1). Starting with this coarse resolution and downscaling to the inshore region includes the large-scale circulation that influences the nearshore circulation. This large spatial scale combined with high resolution nearshore is necessary to investigate nearshore ecological processes like larval transport. Adult kelp rockfish reside in kelp forests which are located very close to shore in shallow water (depths less than 30 m). Larvae are released in these nearshore areas, where variations in the coastline and bottom depth have a large influence on circulation. Then, kelp rockfish larvae develop for a period of 1-2 months before settling in the kelp forest canopy. During this time, larvae are moved by the ocean currents and potentially transported great distances along the coast or offshore. Our model resolves the nearshore study region in appropriate detail and covers a large spatial domain to allow the ocean currents to potentially move larvae a great distance and return to the study region. Building this model has been an extremely exciting and challenging aspect of this project!
After building this model, we started investigating the circulation within Carmel Bay during the late spring and summer months – the period corresponding to when kelp rockfish larvae are being released and transported by the ocean currents before settlement. During the spring and summer months, water flows clockwise in Carmel Bay, entering the northern part of the bay and out of the southern region. Interestingly, the tidal circulation has a strong influence in southern Carmel Bay causing a strong, concentrated outflow off Point Lobos (southern boundary of Carmel Bay) and periodic upwelling of deeper, nutrient-rich water near Point Lobos. It is important to investigate the circulation patterns within our study region to explain and predict the direction of transport and eventual destination of larvae released in Carmel Bay and its marine protected areas.
Now, for the heart of the oceanographic portion of this project. As expected, many larvae released near the surface moved rapidly southward and away from the study region. These larvae were transported by the surface, wind-driven layer which predominately flows southward along the coast and offshore. Only a few larvae (< 2%) had northward connectivity from Carmel Bay into southern Monterey Bay. These larvae were transported to southern Monterey Bay through a variety of pathways shown in Figure 2. So far, we have identified a subsurface, nearshore northward current transporting larvae from Carmel Bay to southern Monterey Bay. It takes at least 2.5 days for a larvae released in Carmel Bay to reach southern Monterey Bay. This subsurface current is a little deeper (~20 m and deeper) during upwelling months (May and June) and closer to the surface (~2 m and deeper) during summer months (July and August). This subsurface, nearshore northward current acts as a consistent mechanism that can transport larvae northward along the central coast.
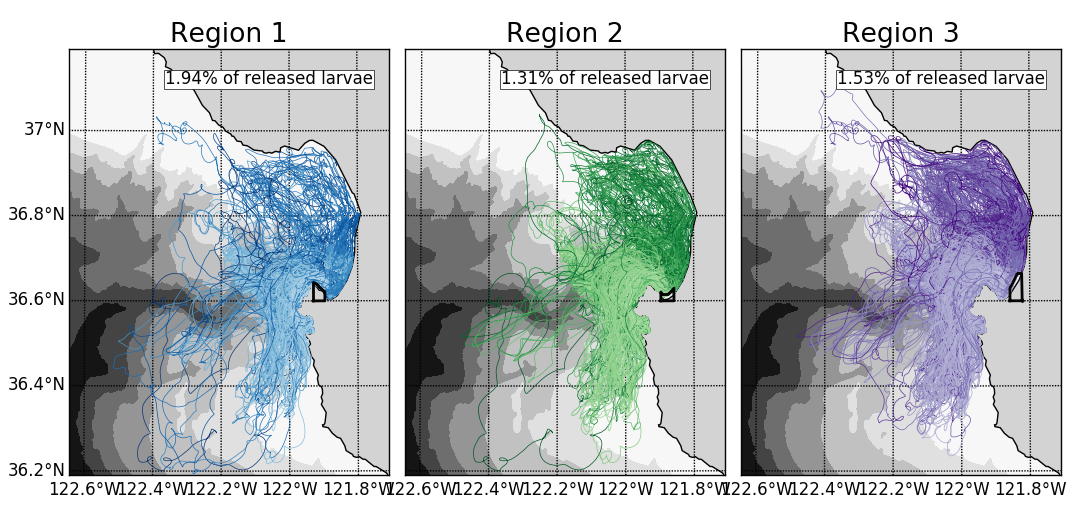
Figure 2. Displays the larval trajectories of all floats entering the three regions in southern Monterey Bay within 30 days. In this simulation, larvae were released in June. Upper right corner displays the percentage of the total larvae released that enter each of the respective regions. Gray shading denotes bathymetry.
We are still in the investigative stages of this project, determining how to best quantify this realistic, complicated process. For our model, we assign numerical values for the timing of larval release, larval buoyancy, duration of the pelagic period, and the window of opportunity to settle. Fine tuning these numerical parameters to best reflect kelp rockfish larvae is a delicate process.
Check back for more results in the future! Also check out Anna Lowe’s blog post on the development of models to help us understand water circulation in Carmel Bay.